Hidden ICT costs

Larger organisations are exposed to central IT costs, decentralised IT costs, IT costs in projects, SaaS purchases by business units, outsourced IT-related services and even hidden ‘Shadow IT’. IT costs vanish into the aggregation of costs by department, business unit, geography or P&L. Consequently, there is no longer a central location at which you can find a cross-section of your overall IT costs. While these kinds of insights can help you identify potential savings or synergies—sometimes worth many hundreds of thousands of Euros—eV-ict provides you with insights from different angles by distilling IT data from your administrative and technical systems and making these data (re)usable. This allows you to make IT costs controllable to the fullest extent possible.

Substantiation of IT costs

C-level management often challenges IT costs because it has insufficient understanding of where they originate and why they are incurred. Thanks to eV-ict’s unique data model, aggregated IT costs can be easily dissected on a level-by-level basis, even down to the finer detail of the original source of information, such as an invoice line. This can be carried out using the various drill-down options available in the eV-ict application. This way, costs can be traced back to their origin and the use of IT can be reconsidered or adapted.

Realistic analysis capabilities

If ever you have wanted to analyse a specific aspect of your IT costs, you will have generated a ‘good-enough’ report to help you. eV-ict does things a little differently—all IT information relating to costs is continuously subsumed into a single unique data model. This is the basis on which you can carry out analyses—by cost source, IT service, supplier, user, IT component or period. The new analysis capabilities ensure that you are armed for every external or internal IT cost discussion or change plan that you hope to shape.

A justified budget

Major changes to the IT environment often yield less than advance calculations or estimates suggest might be possible. Follow-up phases typically follow in order to help realise the intended gain. This is because of the ‘iceberg effect’—people see the top or the area the change was focused at and budgeted for, but the part below the surface of the water remains hidden. The part below the surface of the water is where all of the indirect and hidden yet related costs are that were not seen during the decision-making process. Consequently, they were not addressed. eV-ict brings together all IT costs and dependencies in a single data model, helping to make the complete impact of change immediately clear. Doing this can also help to uncover larger areas that will become redundant as a result of the scheduled change.  Periodic eV-ict reports make it easier to track whether or not all savings that a change can bring about are actually being attained.

Reasonable and equitable charge-ons

The charging on of IT costs is often a ‘finance jolly’—after all, the finance department needs to be able to report the costs somewhere. This kind of approach can lead to reluctance amongst business units to control ‘overheads’. eV-ict can formulate charge-ons based on the demonstrable use of IT. As use can be demonstrated, this will also give business units a sense of ‘ownership’. In turn, this will lead to targeted IT budget control and more rapid absorption of IT innovation to reduce costs. As a direct result, purchases of items like licences can be improved and better targeted as the exact numbers of users will be known.

Validation of changes

C-level managers often consider IT costs to be excessively high and demand explanations from their business managers and their IT Manager and/or insist that IT budgets be reduced. As organisations lack centralised and full insight into IT expenditure, these explanations can be unpleasant. With eV-ict, there is bottom-up and top-down transparency of all IT costs and IT use. Both can be reported periodically and compared with budgets and trends. This way, defence can be transformed into controllability.

User rights as a source of savings

Software is purchased in a variety of different ways, from various locations and for numerous reasons— bundled with systems, as part of a SaaS service, underlying a data centre or database, anticipating organisational growth or growth in use and acquired in an equal number of divergent licensing models. Considerable cost savings can be achieved without impacting the operational performance of the organisation by matching the purchased licenses to actual use and thus negotiating an optimal licensing model. eV-ict can map the presence of usage rights and their actual use within its unique data model.

Monitoring of IT policies

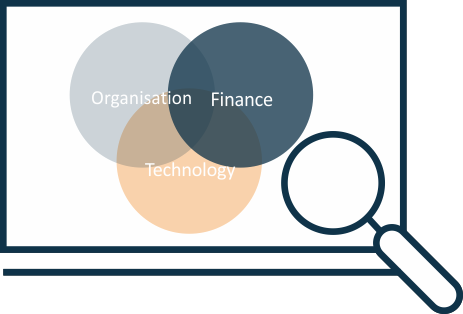
You have deliberately opted not to use certain software and/or tools in your organisation to avoid the uncontrolled growth of suppliers or to force volume discounts. Alternatively, you might want a higher level of data security and privacy protection for different (public) cloud services. eV-ict brings together all IT finances, IT technology and IT organisation into a single data model. With this, we can report deviations from your policies on a monthly basis, thus enabling adjustments and specific interventions where necessary.

Trend analyses

Generic trend analyses by IT specialists rarely fit your specific situation. It’s a case of apples and oranges. Still, there is a lot to compare, with external or internal benchmarks thrown in—provided that it is clear what exactly you are comparing. eV-ict brings together all of your organisation’s IT costs into a data model to facilitate flexible comparison, whatever the benchmark. Why is an IT service in one of your business units cheaper than in another? What can outsourcing to a supplier yield if you compare the true costs and performance? eV-ict can help with insights.

null

INSIGHT

null

CONTROL

null

AWARENESS

null

INSIGHT

null

CONTROL

null

AWARENESS